Visualization 
initialization 
Start backend 
before start trescope, remember to start backend in terminal
trescope
and then appears
Trescope start with
    task identifier: main ,
    task directory: /home/*/.trescope
Available on:
    http://*.*.*.*:9000
    http://*.*.*.*:9000
open second link in browser, then let’s follow the next tutorials
Hint
If one reinstall trescope, please restart the backend, or may waste tons of time. Attention!
Output select 
trescope split window into multiple grids, rowly and columnly, one need to select the grid to plot 3d, 2d, etc.
Trescope().initialize(True, simpleDisplayOutputs(1, 3))
and one may see the following grids with the column size is 3, and row size is 1
to plot your object in the second grid, just use
Trescope().selectOutput(2).plot****
if one split your window into (4, 3) grids, and want to plot object in second grid, it will appears in grids[0][1] instead of grids[1][0].
Output clear 
if one have batch of data to visualise, the batch size exceeds your grid size, and next time you plot following data, pay attention to clear the window.
Trescope().selectOutput(2).clear()
2d plot 
visualise 2d points 
to plot the next three points:
1,1
2,1
3,1
use the following command to plot them
Trescope().selectOutput(1).plotScatter2D(
    [1, 2, 3],
    [1, 1, 1],
).withConfig(Scatter2DConfig().name('plotScatter2D').color(0xffff0000).size(1))
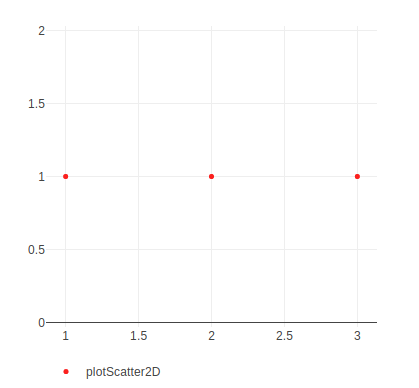
plotScatter2D read points using slightly different format, remember to split x,y into different lists like this.
withConfig set the attributes to be visualised in browser, check api inside, one may set color, size etc
set up breakpoint 
sometimes to debug code, when visualise one image or points, one can set breakpoint in trescope, no need to set up breakpoint in code:
Trescope().breakPoint('check')
now, the code stops at here, when click CONTINUE button, the code steps forward.
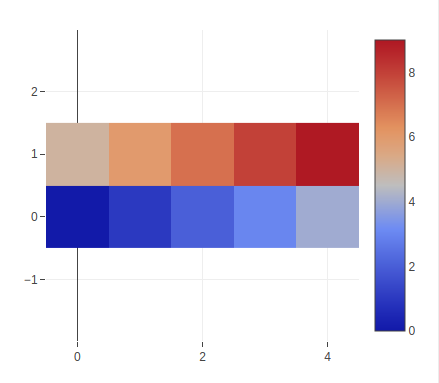
visualise heatmap 
to plot a simple heatmap
import numpy as np
Trescope().selectOutput(7).plotHeatMap(np.array(range(10)).reshape((2, 5))).withConfig(HeatMapConfig().useGL(False))
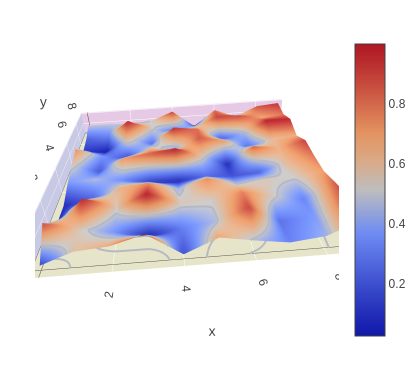
visualise surface 
to plot a random surface
import numpy as np
    Trescope().selectOutput(8).plotSurface3D(np.random.rand(100).reshape((10, 10))).withConfig(Surface3DConfig())
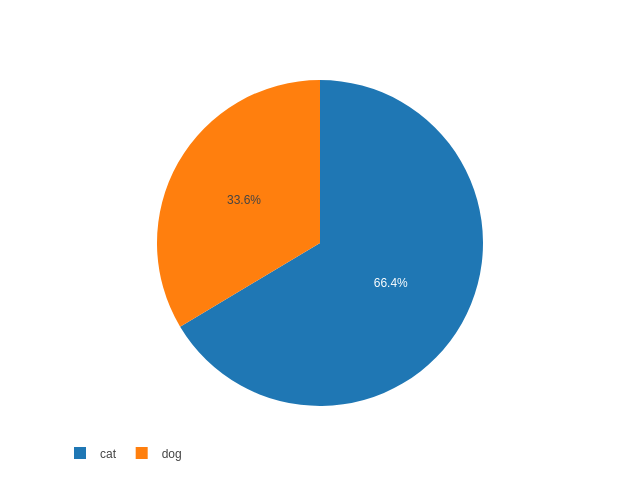
visualise pie figure 
to plot a simple pie figure
Trescope().selectOutput(0).plotPie(['dog', 'cat'], [45, 89]).withConfig(PieConfig())
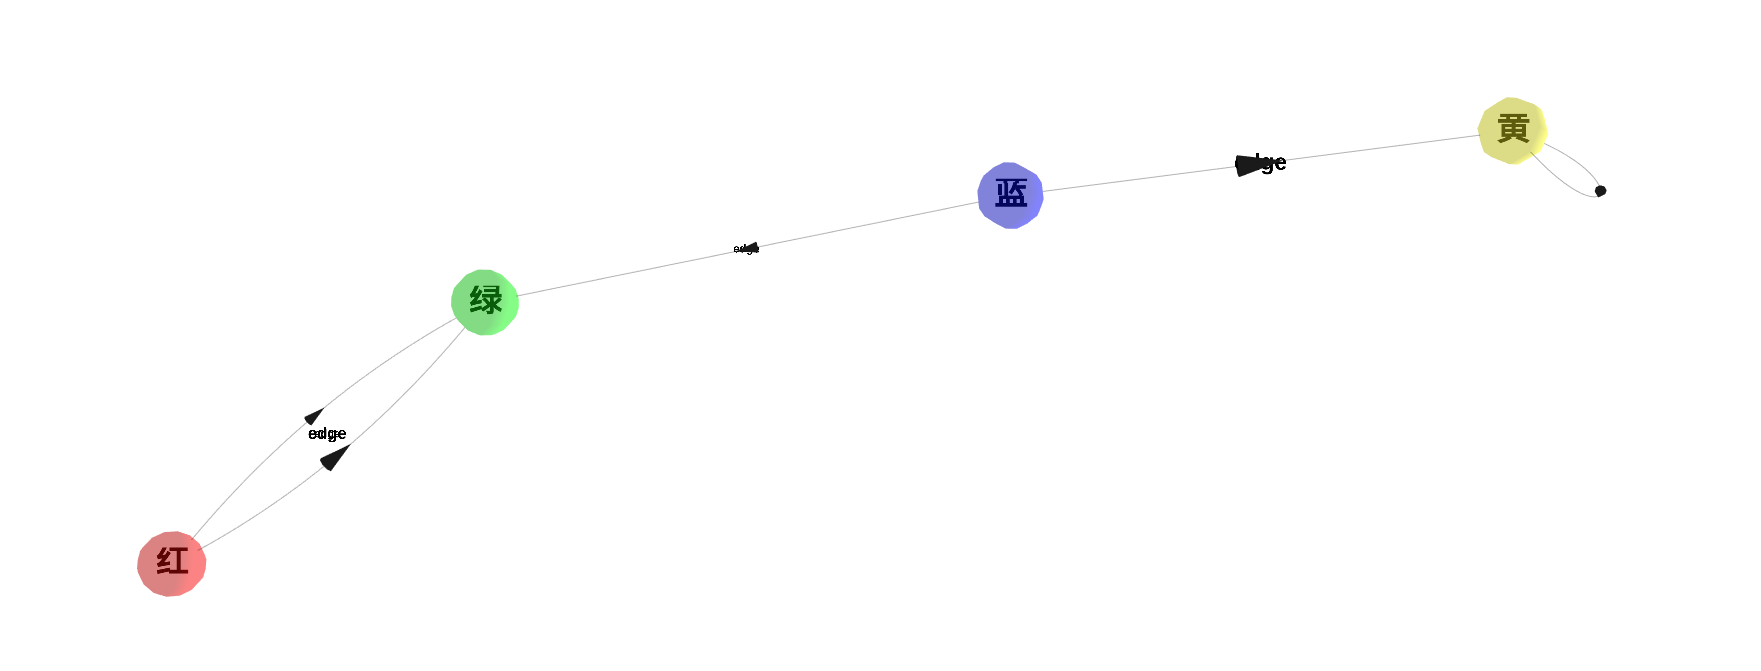
graph plot 
visualise graph 
for the next graph data composed of vertices and edges:
vertex=np.array([[255, 0, 0, 0xff0000],
                [0, 255, 0, 0x00ff00],
                [0, 0, 255, 0x0000ff],
                [255, 255, 0, 0xffff00]]).T,
link=[
    [0, 0, 2, 3, 2],
    [1, 1, 1, 3, 3]
],
edge=np.array([[100, 90],
              [900, 802],
              [987, 234],
              [777, 990],
              [123, 345]]).T
use this command to plot:
(Trescope()
    .selectOutput(0)
    .plotGraph(
    vertex=np.array([[255, 0, 0, 0xff0000], [0, 255, 0, 0x00ff00], [0, 0, 255, 0x0000ff], [255, 255, 0, 0xffff00]]).T,
    link=[
        [0, 0, 2, 3, 2],
        [1, 1, 1, 3, 3]
    ],
    edge=np.array([[100, 90], [900, 802], [987, 234], [777, 990], [123, 345]]).T
).withConfig(
    GraphConfig()
        .vertexDescription(['红', '绿', '蓝', '黄'])
        .vertexSize(3)
        .vertexColor([0xff0000, 0x00ff00, 0x0000ff, 0xffff00])
        .vertexOpacity(.5)
        .edgeDescription('edge')
        .edgeColor('black')
        .edgeWidth([1.5, 1, 1, 1, 2])
        .edgeOpacity(.3)
))
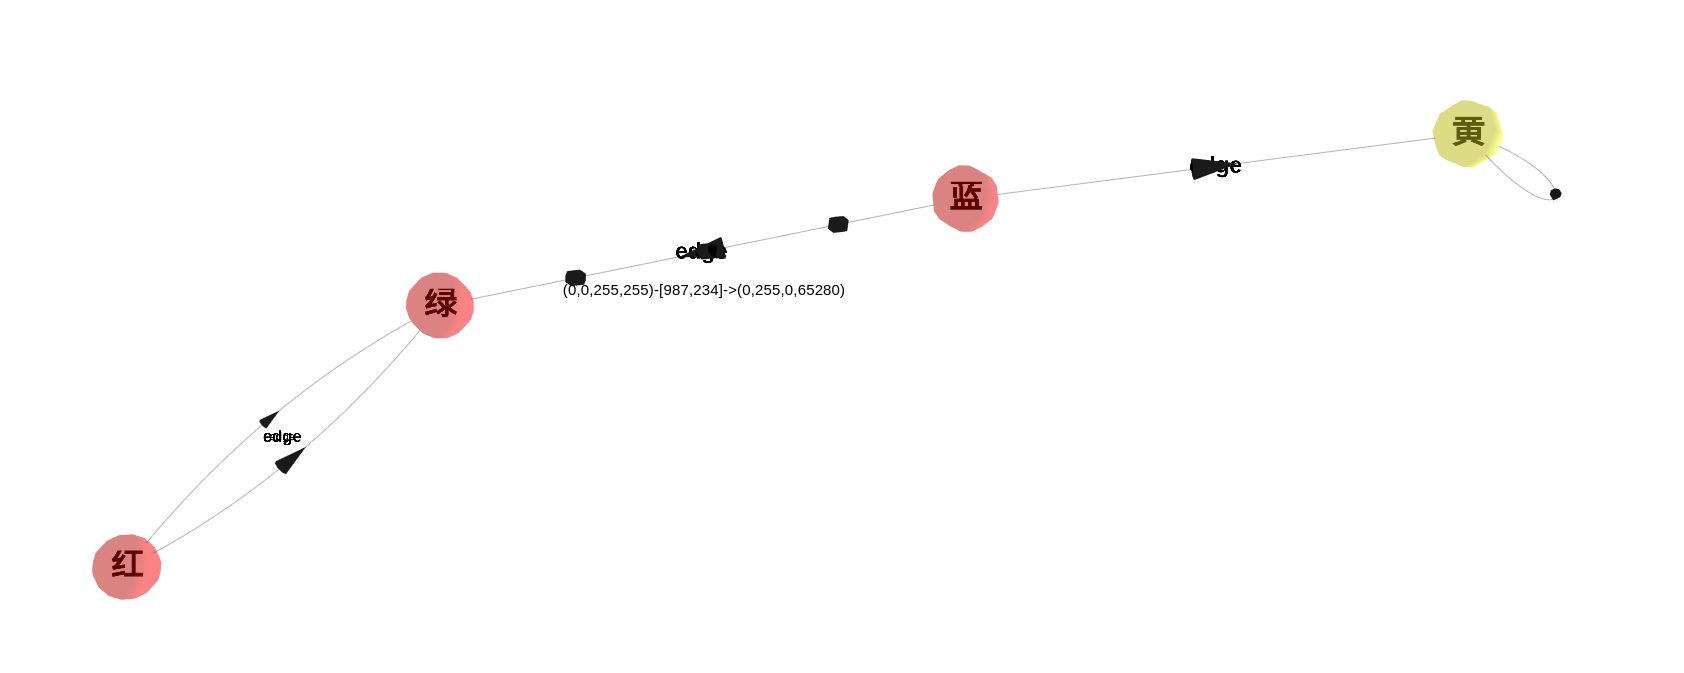
visualise edge 
if one put mouse pointer on the graph edge, the edge direction appears, with edge starting point, end point, as well as edge attributes
3d plot 
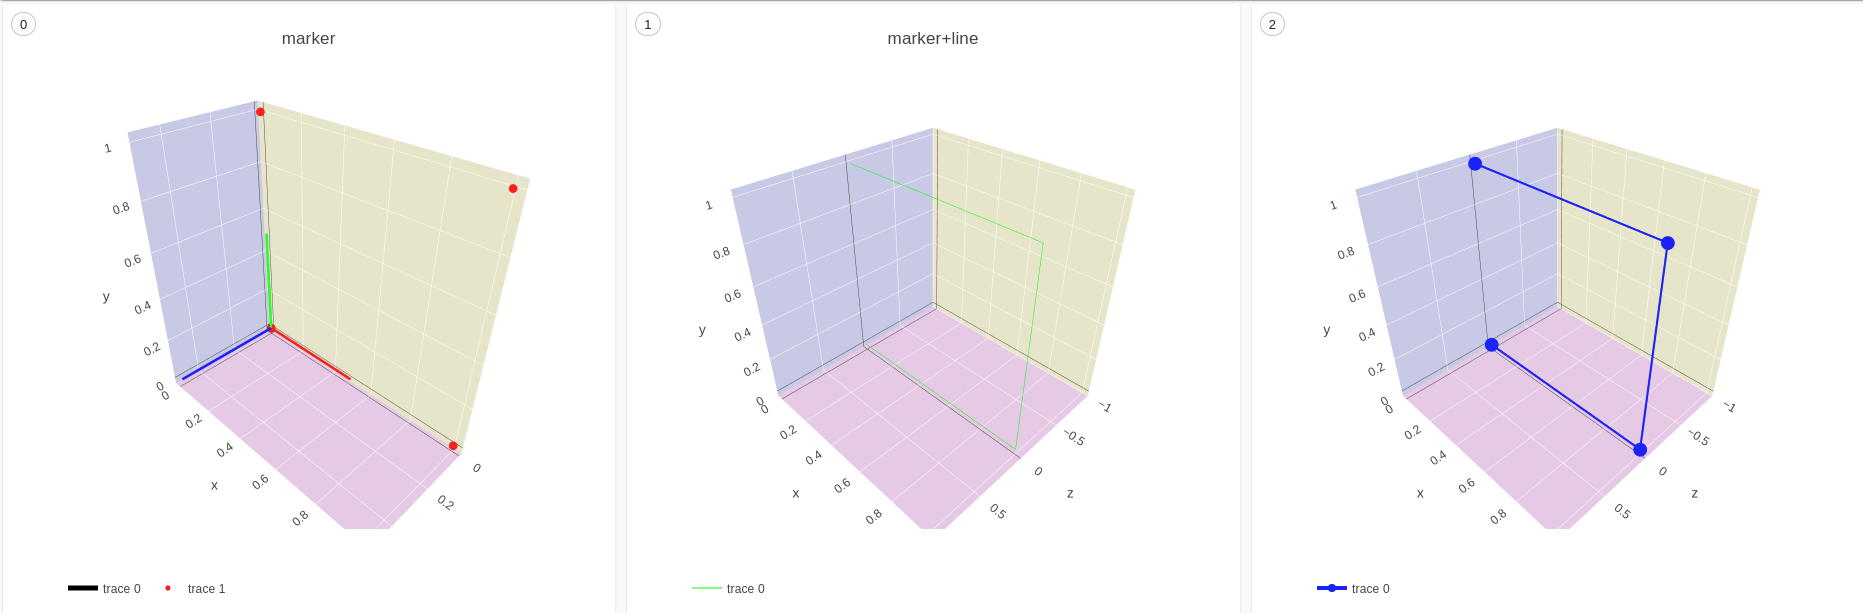
visualise 3d points 
to plot the next four points:
0,0,0
1,0,0
1,1,0
0,1,0
use the following command to plot them
Trescope().selectOutput(0).plotScatter3D(
        [0, 1, 1, 0],
        [0, 0, 1, 1],
        [0, 0, 0, 0]
    ).withConfig(Scatter3DConfig().color(0xffff0000).mode([ScatterMode.MARKERS]))
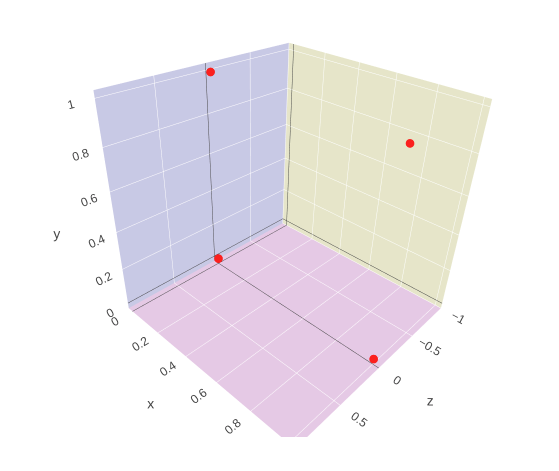
plotScatter3D read points using slightly different format, remember to split x,y,z into different lists like this.
withConfig set the attributes to be visualised in browser, check api inside, one may set color, size etc
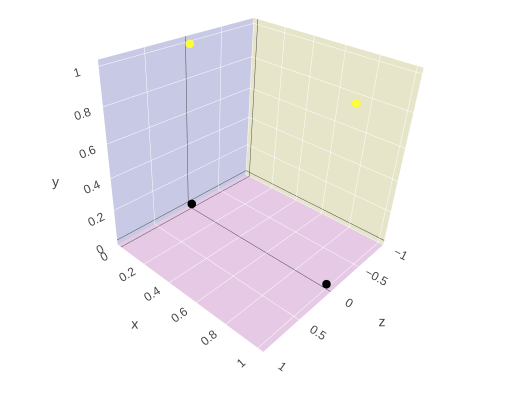
different point colors 
to plot points with different colors, one can use the following command
label = [0,0,1,1]
color = [toolbox.color_from_label(_label) for _label in label]
Trescope().selectOutput(1).plotScatter3D(
    [0, 1, 1, 0],
    [0, 0, 1, 1],
    [0, 0, 0, 0]
).withConfig(Scatter3DConfig().color(color).mode([ScatterMode.MARKERS]))
visualise vectors 
to plot the next three vectors:
start point  ->  end point
  (0,0,0)         (0,1,0)
  (1,0,0)         (1,1,1)
  (2,0,0)         (0,-1,0)
use the following command to plot them
Trescope().selectOutput(3).plotLollipop3D(
    [0, 1, 0],
    [1, 1, -1],
    [0, 1, 0]
).withConfig(Lollipop3DConfig().locations([0, 1, 2],
                                          [0, 0, 0],
                                          [0, 0, 0]).name('plotLollipop3D').color(0xffff0000))
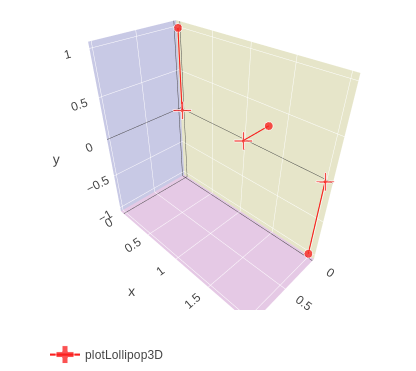
one can see that the cross is the starting point, the point is the end point
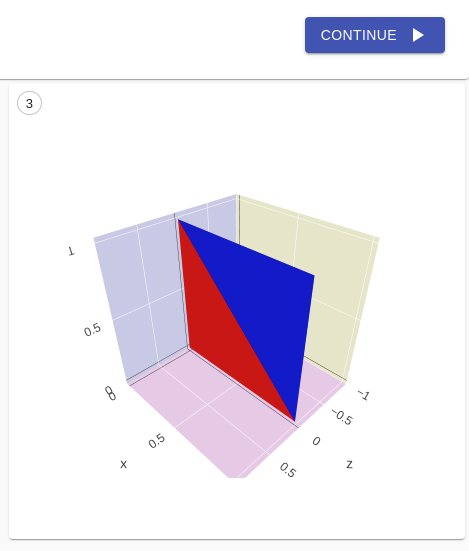
mesh plot 
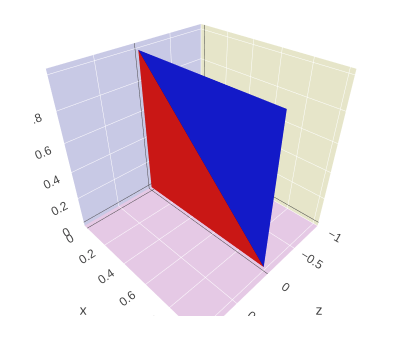
visualise mesh 
to plot the next example mesh:
vertices:
    [0, 1, 1, 0],
    [0, 0, 1, 1],
    [0, 0, 0, 0]
face indices:
    [0, 3],
    [1, 1],
    [3, 2]
use the following command to plot them
Trescope().selectOutput(0).plotMesh3D(
    [0, 1, 1, 0],
    [0, 0, 1, 1],
    [0, 0, 0, 0]
).withConfig(Mesh3DConfig().indices([0, 3],
                                    [1, 1],
                                    [3, 2]).color(0xffff00ff))
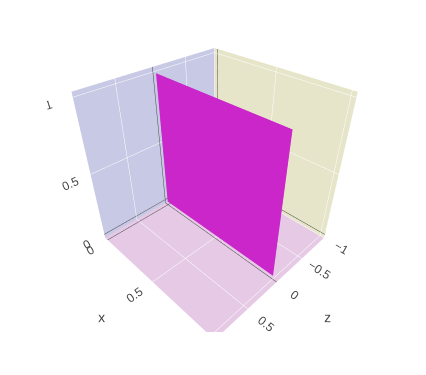
like plotScatter3D , plotMesh3D read points using same format, remember to split x,y,z into different lists like this. in Mesh3DConfig , one can set indices, color , above example show two faces, [0,1,3] is first triangle, and [3,1,2] is the second triangle
different mesh face colors 
to plot mesh with different colors, one can use the following command
Trescope().selectOutput(1).plotMesh3D(
    [0, 1, 1, 0],
    [0, 0, 1, 1],
    [0, 0, 0, 0]
).withConfig(Mesh3DConfig().indices(
    [0, 3],
    [1, 1],
    [3, 2]).faceColor([0xffff0000, 0xff0000ff]))
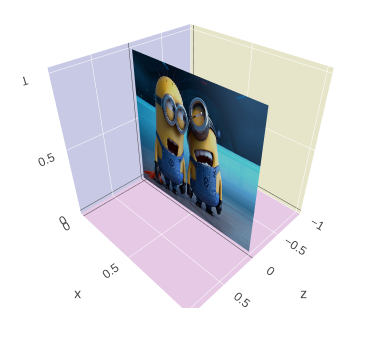
visualise mesh with texture 
to plot mesh with texture, one can use the following command:
Trescope().selectOutput(2).plotMesh3D(
    [0, 1, 1, 0],
    [0, 0, 1, 1],
    [0, 0, 0, 0]
).withConfig(Mesh3DConfig().indices(
    [0, 3],
    [1, 1],
    [3, 2])
    .texture('http://personal.psu.edu/xqz5228/jpg.jpg')
    .textureCoordinate(
    [0, 1, 1, 0],
    [0, 0, 1, 1], ))
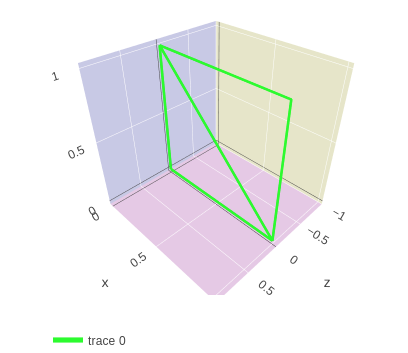
visualise mesh with wireframe 
to plot mesh with a skeletal three-dimensional model in which only lines and vertices are represented, one can use the following command:
Trescope().selectOutput(1).plotWireframe3D(
    [0, 1, 1, 0],
    [0, 0, 1, 1],
    [0, 0, 0, 0]
).withConfig(Wireframe3DConfig().indices(
    [0, 3],
    [1, 1],
    [3, 2]).color(0xff00ff00).width(5))
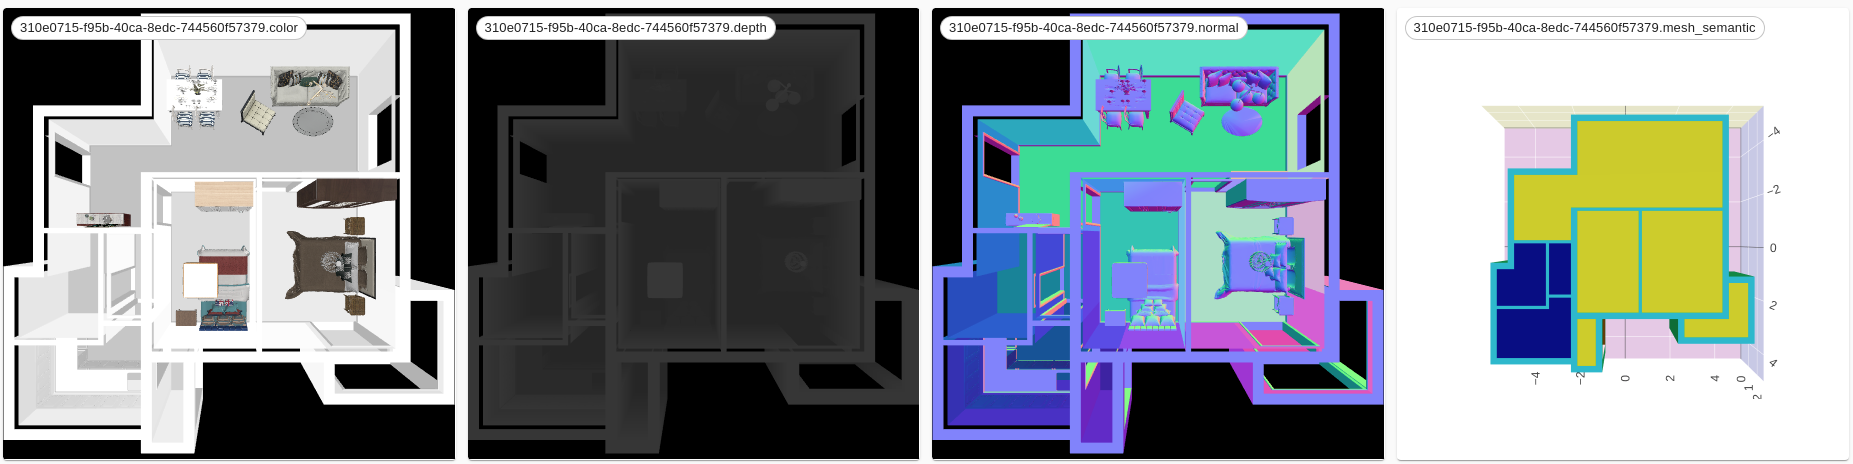
3d front plot 
trescope support visualization of various 3D data types, such as mesh, voxel, point cloud and so on, it is worth mentioning that we also support 3D-FRONT [1] dataset visualization(which is a fantastic scene dataset from Alibaba)
different renderType 
to plot with color renderType:
Trescope().selectOutput(9).plotFRONT3D('../data/res/3D-FRONT-samples/scenes/310e0715-f95b-40ca-8edc-744560f57379.json').withConfig(
FRONT3DConfig()
    .view('top')
    .renderType('color')
    .shapeLocalSource('../data/res/3D-FRONT-samples/3D-FUTURE-model')
    .hiddenMeshes(['Ceiling', 'SlabTop', 'ExtrusionCustomizedCeilingModel']))
one can change renderType like: color, depth, normal, mesh_semantic
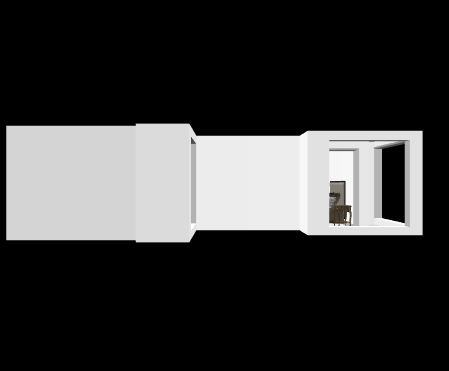
different view Type 
Trescope().selectOutput(10).plotFRONT3D('../data/res/3D-FRONT-samples/scenes/310e0715-f95b-40ca-8edc-744560f57379.json').withConfig(
    FRONT3DConfig()
        .view('front')
        .renderType('color')
        .shapeLocalSource('../data/res/3D-FRONT-samples/3D-FUTURE-model')
        .hiddenMeshes(['Ceiling', 'SlabTop', 'ExtrusionCustomizedCeilingModel']))
@article{fu20203dfront,
    title={3D-FRONT: 3D Furnished Rooms with layOuts and semaNTics},
    author={Fu, Huan and Cai, Bowen and Gao, Lin and Zhang, Lingxiao and Li, Cao and Zeng, Qixun and Sun, Chengyue
            and Fei, Yiyun and Zheng, Yu and Li, Ying and Liu, Yi and Liu, Peng and Ma, Lin and Weng, Le and Hu, Xiaohang
            and Ma, Xin and Qian, Qian and Jia, Rongfei and Zhao, Binqiang and Zhang, Hao},
    journal={arXiv preprint arXiv:2011.09127},
    year={2020}
}